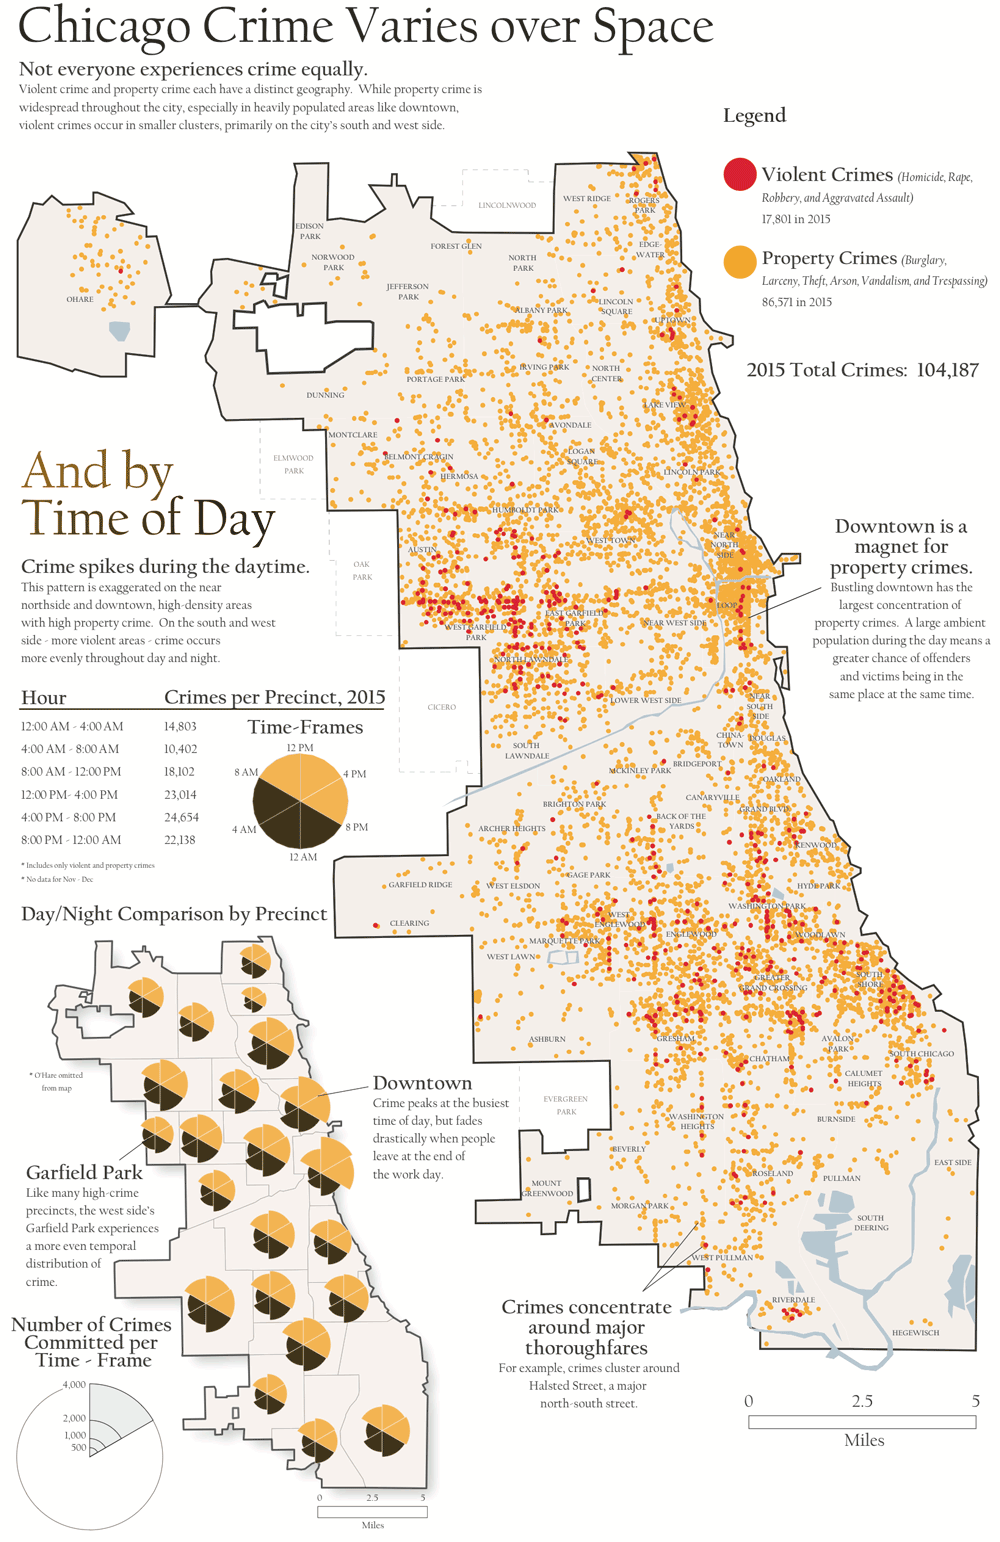
This was my final project for Geography 370, an introductory cartography course at UW Madison. Having just moved to Madison from Chicago, I was curious about the spatial and temporal patterns of crime in Chicago. Does violent crime and property crime share a similar geographic pattern? And during what time of day do these crimes occur?
Crime data is notoriously difficult to obtain, but luckily Chicago provides detailed geo-referenced crime data free-of-charge here, for anyone interested.
The resulting map is a dot density distribution of violent and property crime in Chicago. I also binned crime by time (4-hour intervals) in order to gain some perspective about what time of day crime tends to occur. Since I only looked at total crime for the temporal analysis, the next step would be to break down violent crime compared to property crime, by time of day.
You can find a full PDF of the map here.
