Choose whether to view British, Dutch, French, or Spanish ships.
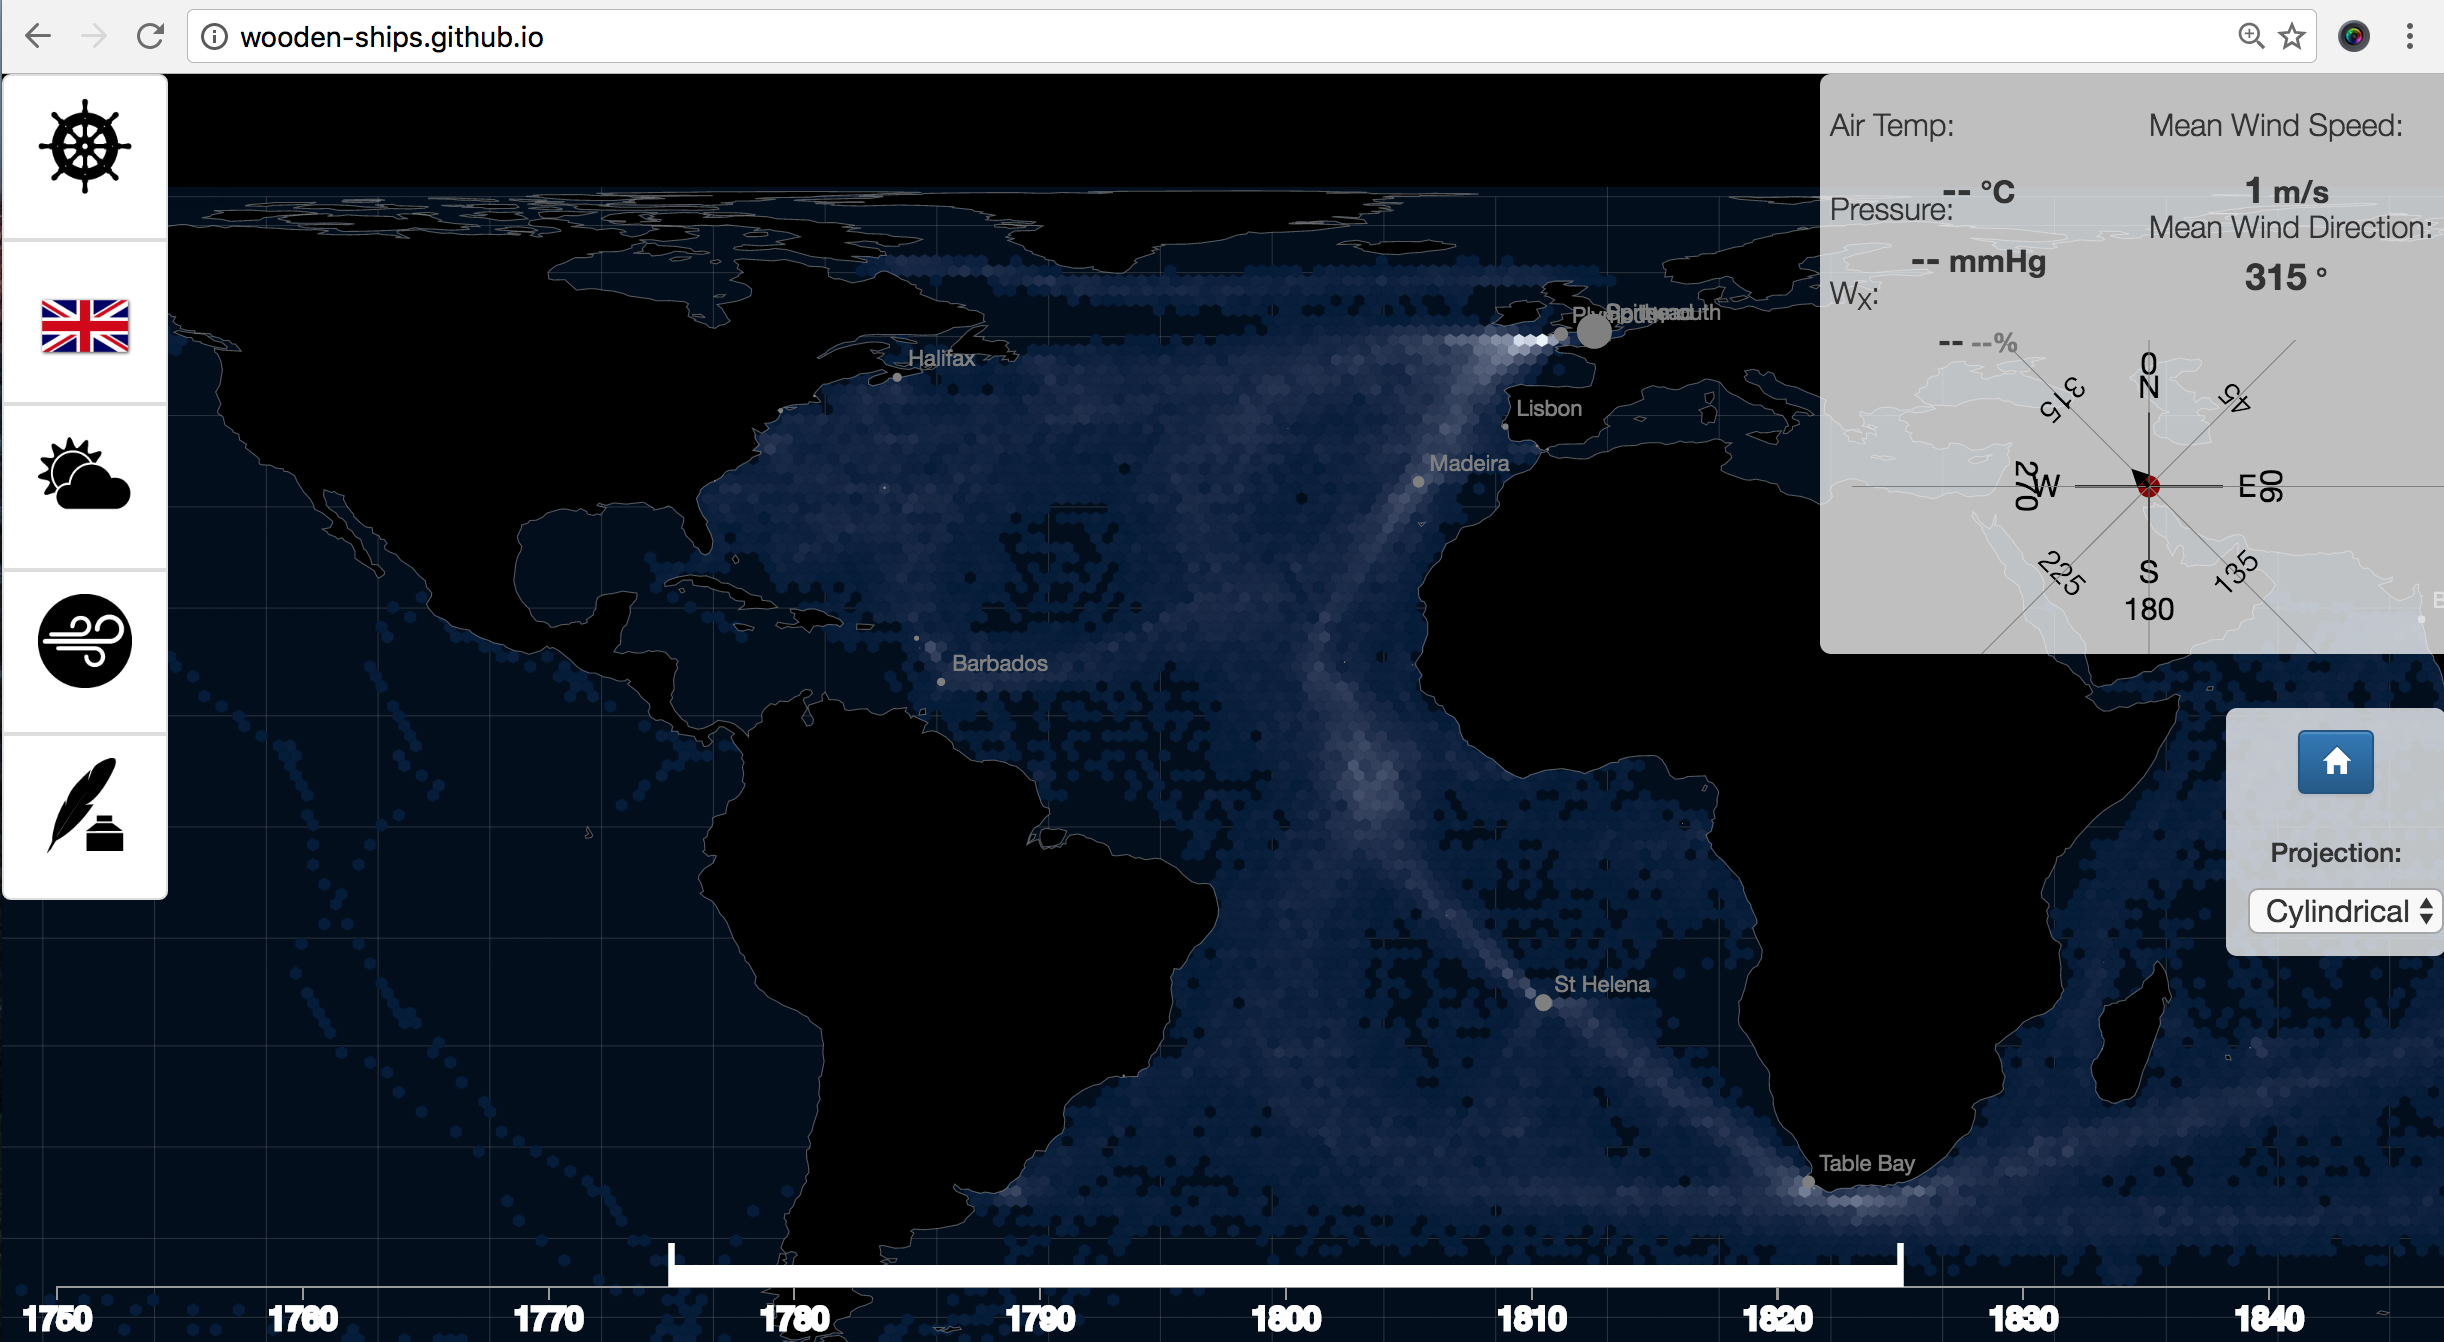
What a fun project this was. I recently collaborated with Scott Farley and Meghan Kelly to build this interactive map. This project was the culmination of Geography 575, an interactive mapping course at UW Madison. The idea was to create an interactive that could visualize European maritime activity and climatological patterns from 1750 to 1850. We aptly named this Wooden Ships .
We primarily used D3 and jQuery to build this. Data was collected from historic captains' logbook entries and ship locations were then aggregated by hexbin for generalization. Users can cue into specific captains' observations by clicking on a hexbin, and also filter ships by time, weather, and ship-nationality.
Check out the full version here.
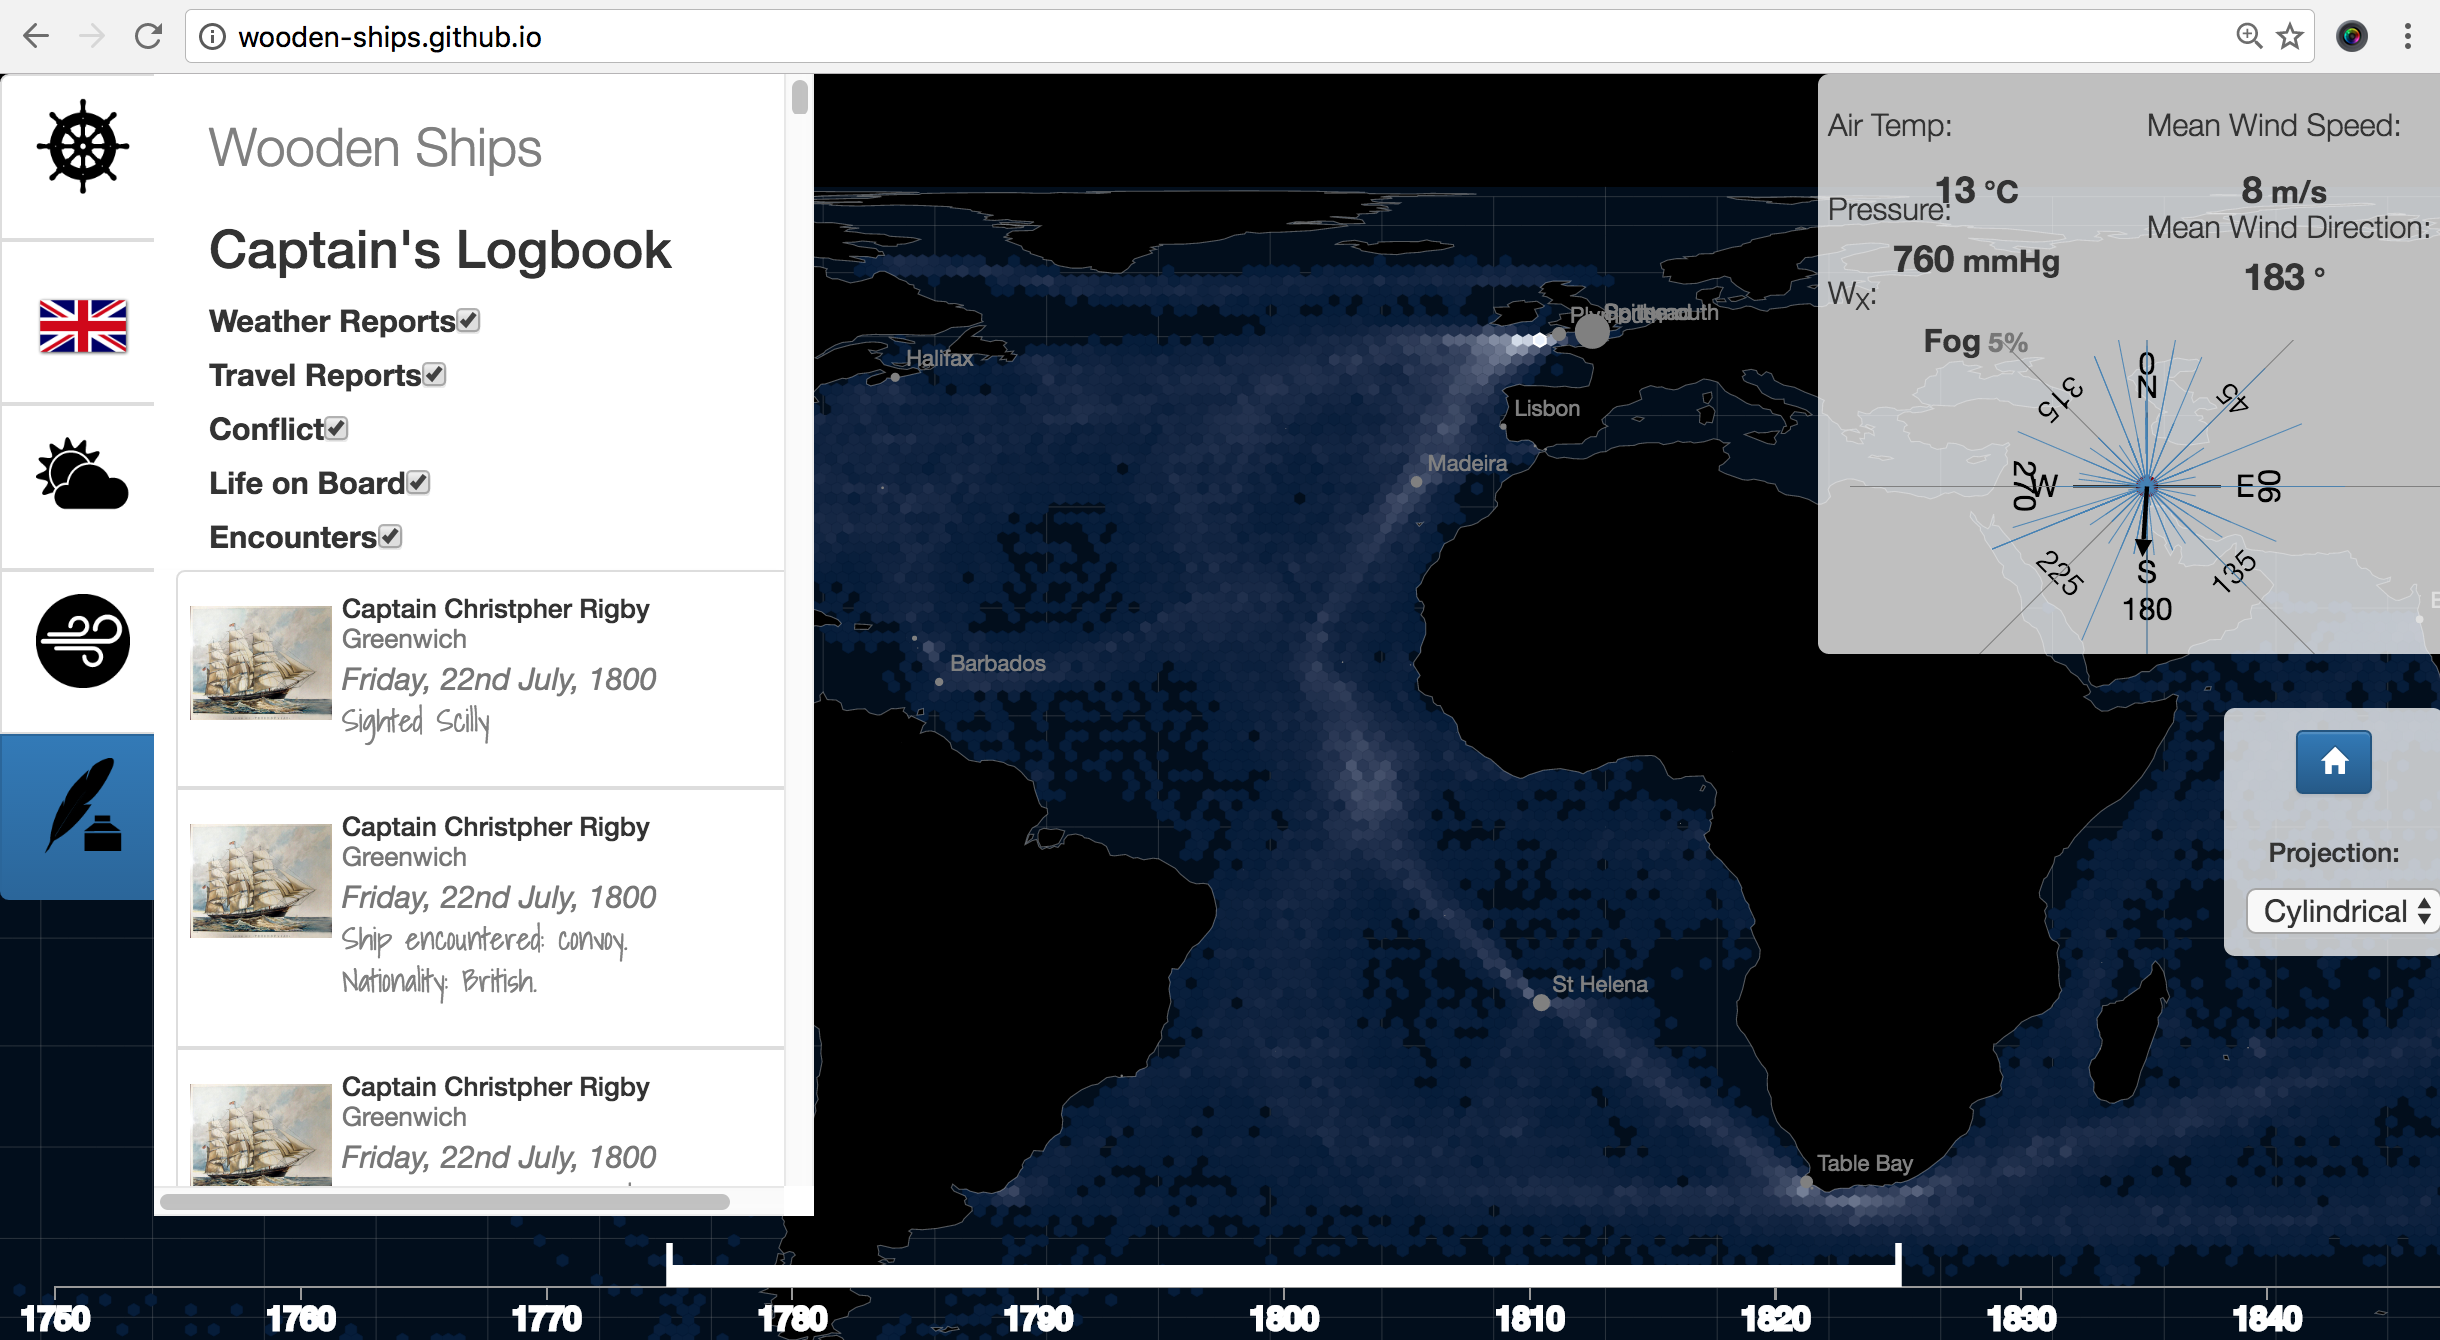
Access logbooks to explore which naval captains were out at sea, and when.
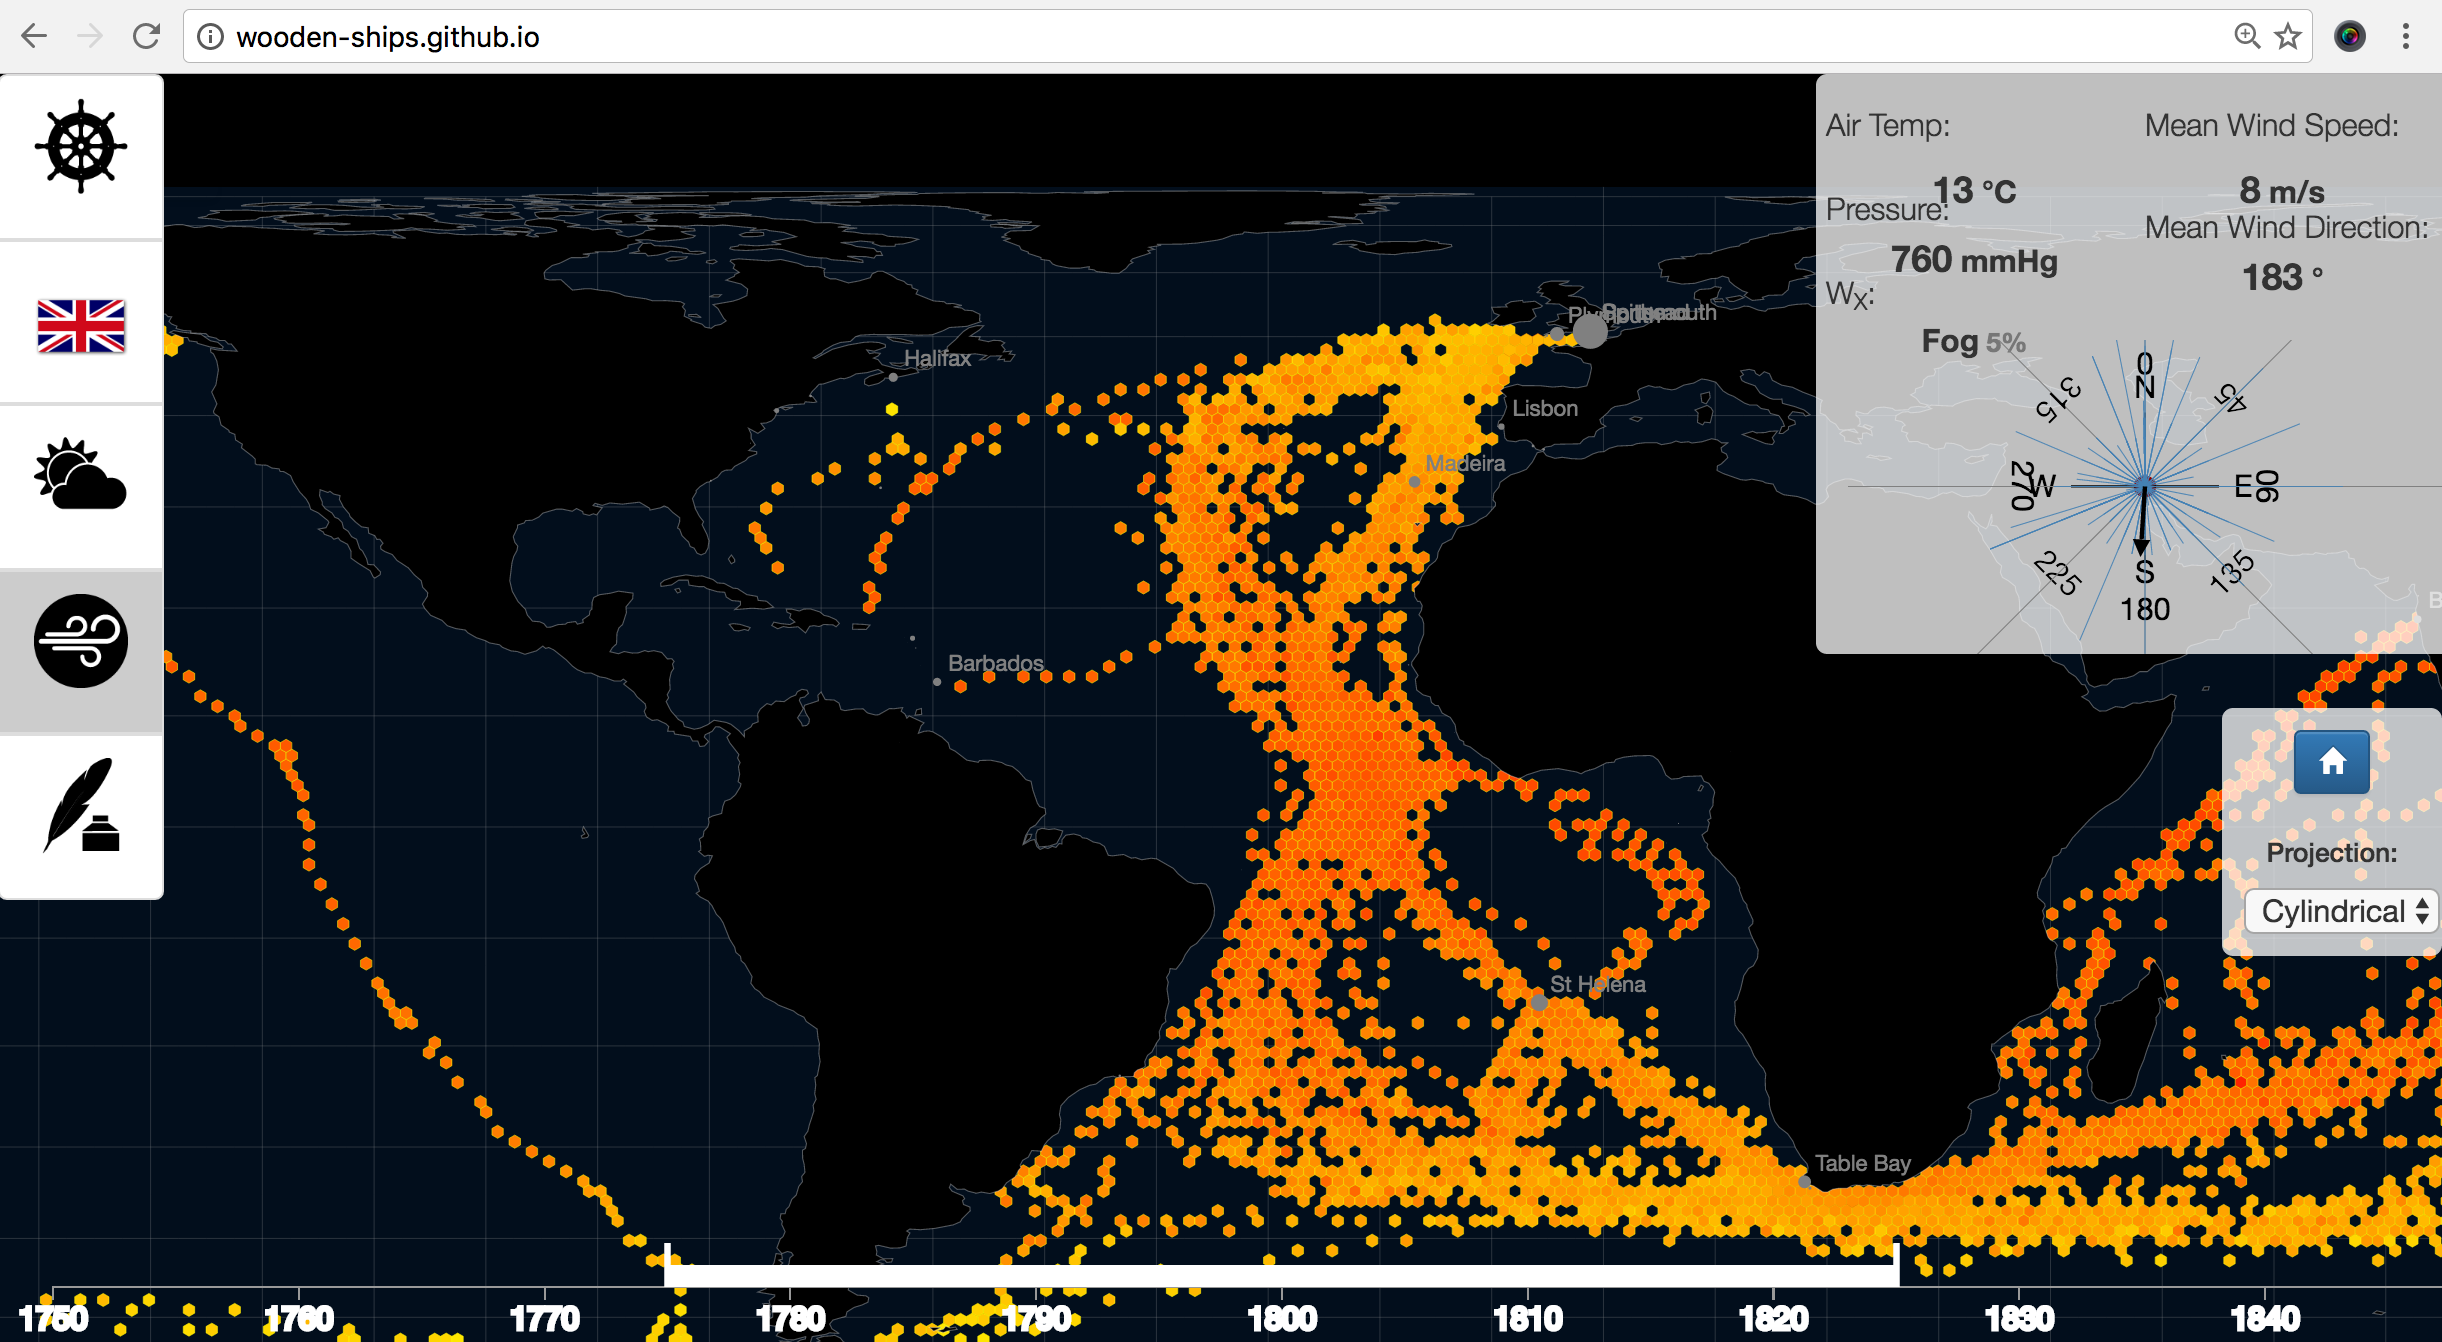
Explore historical weather patterns such as the presence of snow, wind, rain, hail, fog, as well as air temperature readings.