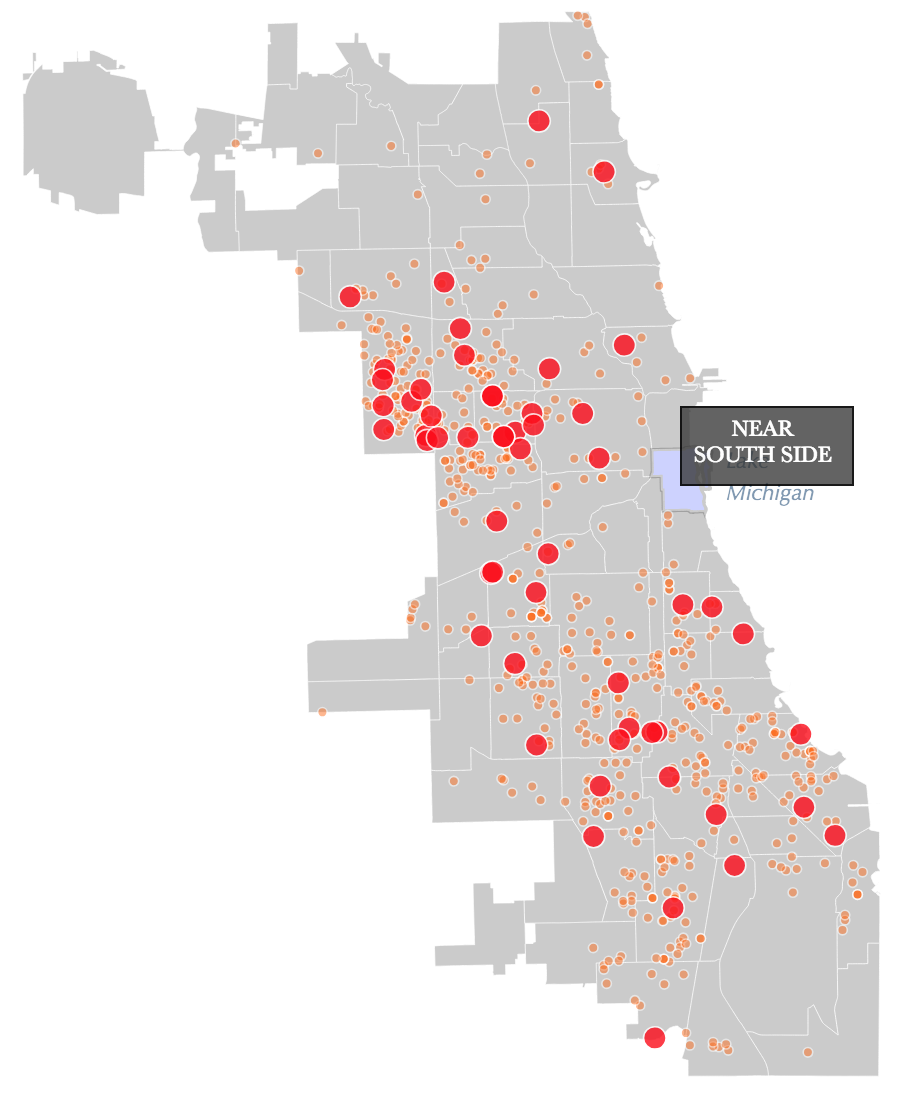
I used D3.js to create this interactive map of homicides in Chicago. I wanted to see whether homicides had a temporal pattern - hence the addition of a time-slider which allows users to visualize crime by month. The map can be viewed here.
Key Features
· Scroll through time to visualize homicides by month
· Retreive information about particular homicides