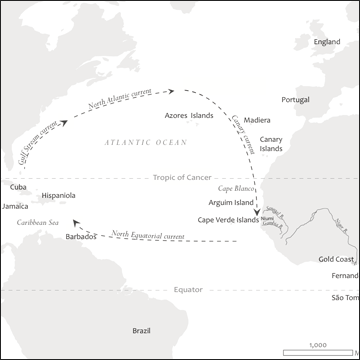
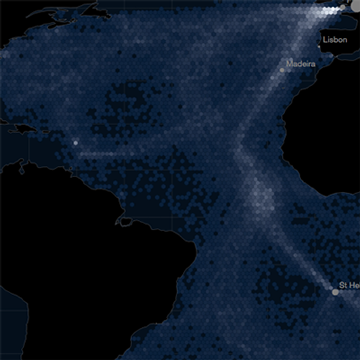
Ever wonder who was out on the high seas hundreds of years ago? Wooden Ships is an interactive for exploring historic maritime activity and weather patterns.

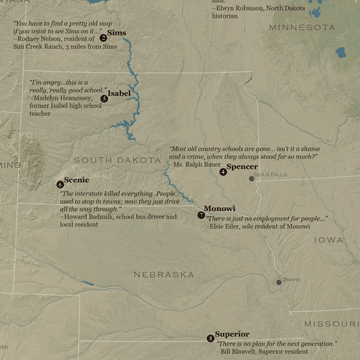
What does it mean to live in the Great Plains? Stories of depopulation and loss from ten small towns on the the brink of collapse.

An infographic that tells the story of abandonment and depopulation in Englewood, Chicago.

Don Wright, a professor at SUNY-Cortland, asked me to redesign some hand-drawn maps for the 4th edition of The World and a Very Small Place in Africa, his book about the Gambia. Take a peek.

A Matrix-inspired slippy map. Created with MapBox and CartoCSS.

This is an interactive I created to show how violent crime varies over Chicago neighborhoods.

Where and when does crime occur in Chicago? This map seeks to answer that question.

This is a proposed bicycle race route through the Yukon, depicting terrain using hillshade and land-cover. It was a super fun project!

Where do tech companies tend to locate in the Bay Area? Where does millennial talent live? Take a look at this interactive story-map to find out.

Does crime really heat up in the summer? This D3.js visualization explores Chicago homicides, by month.